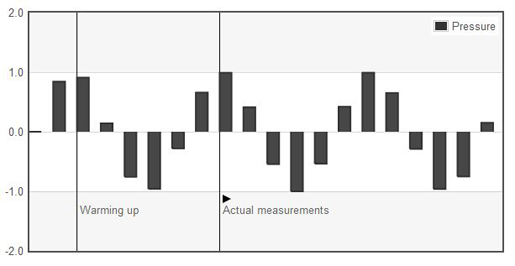
Now while there are quite a number of excellent flash-based graphing libraries out there in the wild, it turns out that there aren’t actually all that many pure old jQuery plugins to churn out your data in pretty images for all to see.
So enter , a pure Javascript plotting library written exclusively for jQuery. It produces graphical plots of arbitary datasets on-the-fly client-side, with a focus on simple usage – meaning that all settings are pretty much optional to a developer. The graphs produces are attractive and flot goes that extra step in adding interactive features like zooming and mouse tracking, meaning you can add things like tooltips and clickthroughs to any graph with particular ease.
It works with Internet Explorer (with the help of the excanvas emulation helper), Firefox, Safari, Opera and Konqueror, making use of the HTML canvas tag.
Quick to implement, churns out a variety of different graphs and produces some stunning results, making it a particularly worthy graphing library to implement on any of your data analysis projects! :)
Related Link: http://code.google.com/p/flot/
You might also enjoy:
-
I mentioned Flot, the brilliant little jQuery-driven graphing engine that is extremely flexible and capable of producing some wonderfully looking and intera ...
-
Flot is a fantastic jQuery-driven graphing engine that is extremely flexible and capable of producing some wonderfully looking and interactive graphs. To ...
-
Jeff Robbins of Lullabot brings to us a rather nifty jQuery plugin in the form of BeautyTips, a tooltips plugin which uses the canvas drawing element from t ...
-
So you are the type of person that likes those cheesy moving, animated characters and backgrounds that appear on numerous websites around the Internet. In f ...
-
My tried and trusted method for inserting graphs into PDFs is to use the nifty PHP FPDF library and insert an image into it via a Google Chart URL. In ot ...


